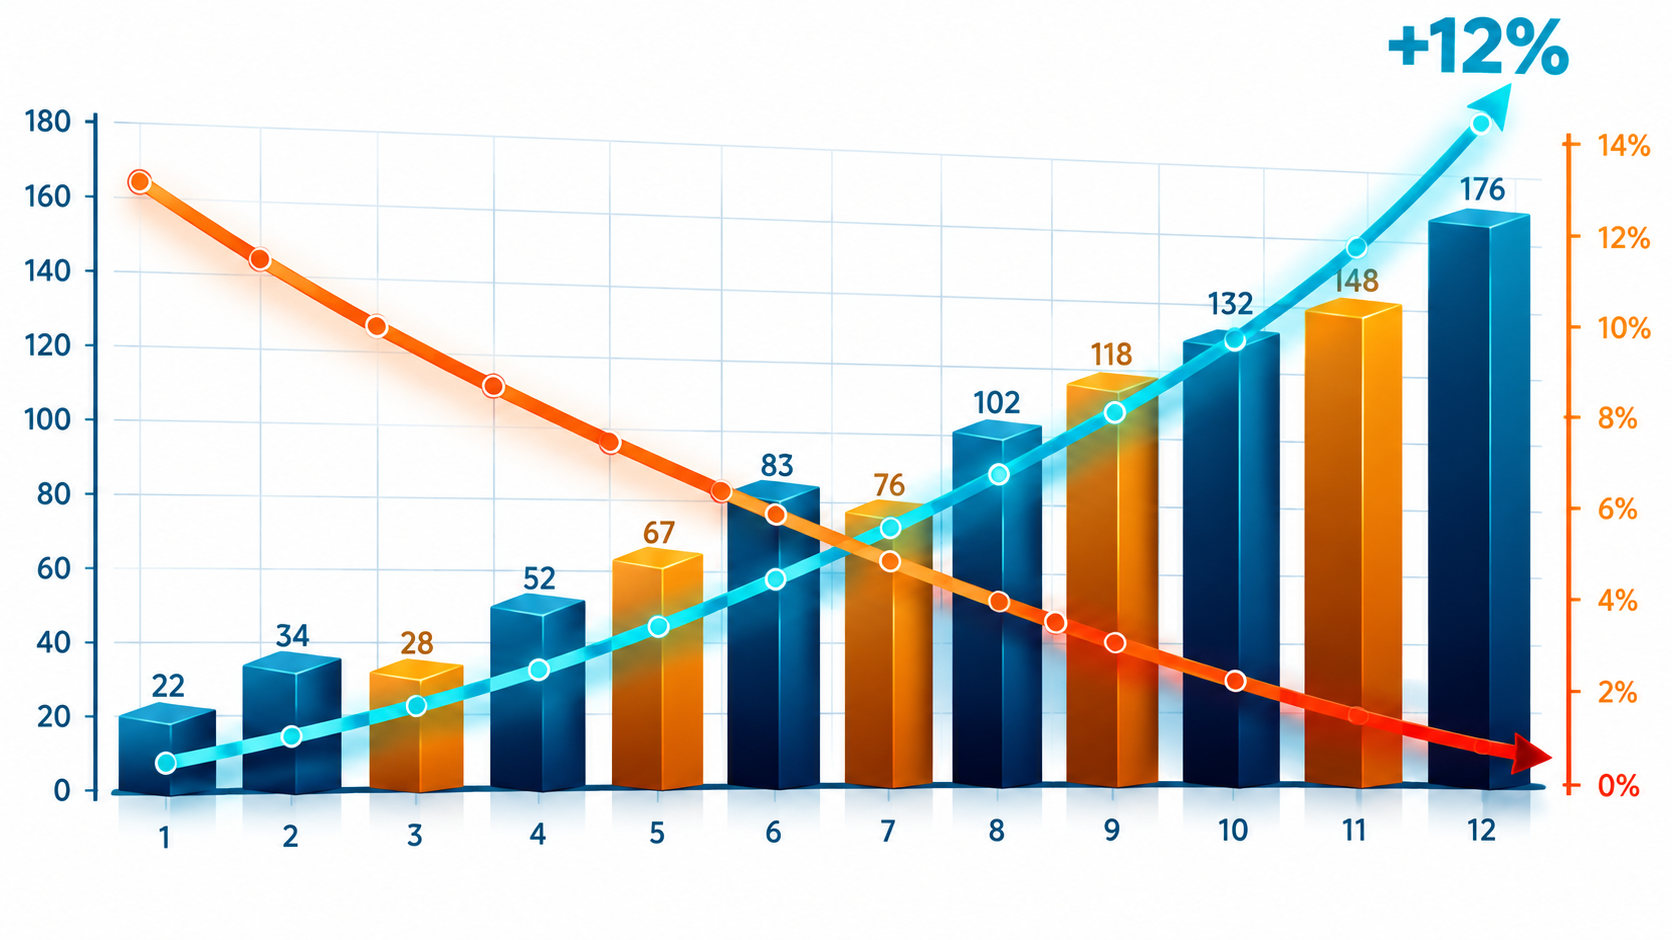
Advanced financial forecasting line graph combined with a modern 3D column bar chart, corporate presentation style, crisp vector design. Features sleek intersecting trend lines: one smooth gradient curve declining sharply, and a bright glowing cyan line surging dramatically upwards to a peak marked with a large, bold numerical text "+12%". Detailed analytical grid lines and professional data markers. The entire layout is data-driven and abstract, containing only numerical values, percentages, and numbers, with absolutely no written words, no English text, and no alphabet letters. Executive boardroom aesthetic with a navy blue, teal, and sharp orange color palette, isolated on a solid crisp white background, high resolution, 8k --no text, words, letters, typography, blurry elements